How to read an MT5 Strategy Tester report
Key takeaways
- A performance report is not worth interpreting until the Journal and test settings show that the intended orders actually ran under known assumptions.
- No single value—net profit, Profit Factor, Sharpe ratio, win rate, or drawdown—can establish that a strategy is robust.
- Compare the full distribution of trades and the balance/equity path across separate periods, then move only to forward demo observation—not directly to live capital.
An MT5 report answers a narrow question: what did this EA do on this symbol, with this data, these inputs, and these tester assumptions? It does not answer whether the same result will occur next month or on another account.
If you have not yet recorded those conditions, begin with How to Backtest an Expert Advisor in MT5. The most sophisticated statistic cannot rescue an experiment that cannot be reproduced.
First, locate the actual report
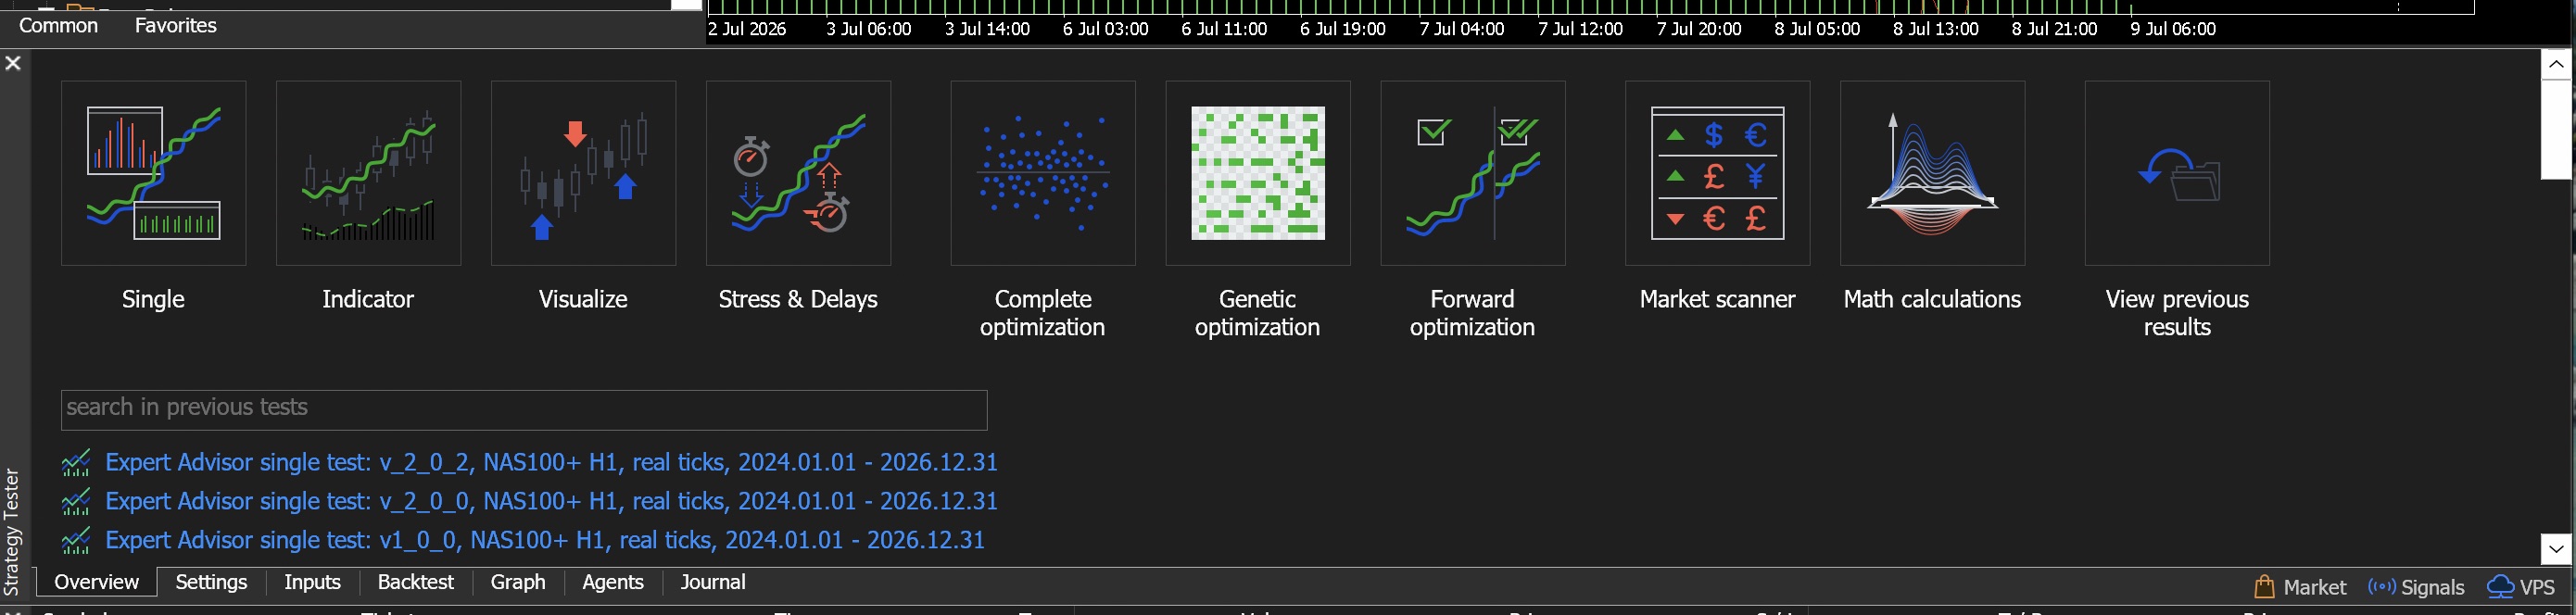
Recent MetaTrader 5 builds can show tabs named Overview, Settings, Inputs, Backtest, Graph, Agents, and Journal. Overview is primarily a start/task screen with options such as Single, Visualize, or Optimization and a list of previous runs. It is not normally where Profit Factor and drawdown are displayed.
After a single test completes, open Backtest. Some MT5 builds, broker-distributed terminals, older screenshots, and documentation use Results for the corresponding output. A separate Report tab may not exist; report export may instead be available from the Backtest/Results context menu.
The official Testing Report reference opens in a new tab documents report fields. Exact placement can still vary by terminal build, so use the meaning of the field—not an assumed tab location—as the stable reference.
Use a validity-first reading order
Read the output in this order:
| Order | Area | Question |
|---|---|---|
| 1 | Journal | Did the EA and tester complete without unexplained data or trade errors? |
| 2 | Settings and Inputs | Can this exact run be reproduced? |
| 3 | Data and costs | What history, spread, commission, swap, and delay assumptions were used? |
| 4 | Backtest or Results summary | What are the sample size, net result, drawdowns, and payoff statistics? |
| 5 | Orders and deals | Did the EA execute the written rule, and are a few trades dominating? |
| 6 | Graph | What happened to balance, open equity, and margin load through time? |
| 7 | Other periods | Does the frozen configuration fail differently on untouched dates? |
This order prevents a common mistake: accepting the headline return before noticing that intended orders were rejected or that the test only covered part of the requested dates.
1. Journal: decide whether the run is interpretable
Search for repeated messages, not just the final “test completed” line.
| Message or condition | Why it matters |
|---|---|
invalid stops | Intended orders or protective levels may have been rejected |
| Insufficient funds / margin | The tested sizing rule could not execute consistently |
| Market closed / symbol disabled | The EA may be using the wrong session or symbol state |
| Missing or unsynchronized history | Part of the requested experiment may not have run as expected |
| Repeated indicator or array errors | Signals may not have been calculated correctly |
| Tester or EA abort | The summary can describe an incomplete run |
A warning is not automatically fatal, but it requires an explanation. Record the count, timestamps, affected orders, and the corrective decision. For repeated stop errors, follow How to Fix “Invalid Stops” in MT5.
2. Settings and Inputs: reconstruct the experiment
Before looking at profit, verify:
- EA file name and version
- exact symbol and timeframe
- explicit start and end dates
- modelling mode and available history
- deposit currency and initial balance
- leverage and execution-delay setting
- spread, commission, and swap treatment
- all inputs, preferably saved as a
.setfile - MT5 build and server/account environment
If any of these are unknown, label the run as exploratory rather than comparable. A screenshot of the final graph alone is not an audit trail.
3. Data quality is not execution quality
The report may show history-quality or tick-history information. Higher-quality source data is useful, but it does not certify the strategy or recreate live execution.
Ask four separate questions:
- Did the available history cover the entire requested interval?
- Was the modelling mode appropriate for intrabar entries, stops, and trailing logic?
- Were costs and spread behaviour representative of the environment being studied?
- Could delay, liquidity, gaps, or rejected modifications change the rule materially?
“Real ticks” describes the historical price input when available. It does not mean “the same as a future live fill.”
4. Read the summary as a set of relationships
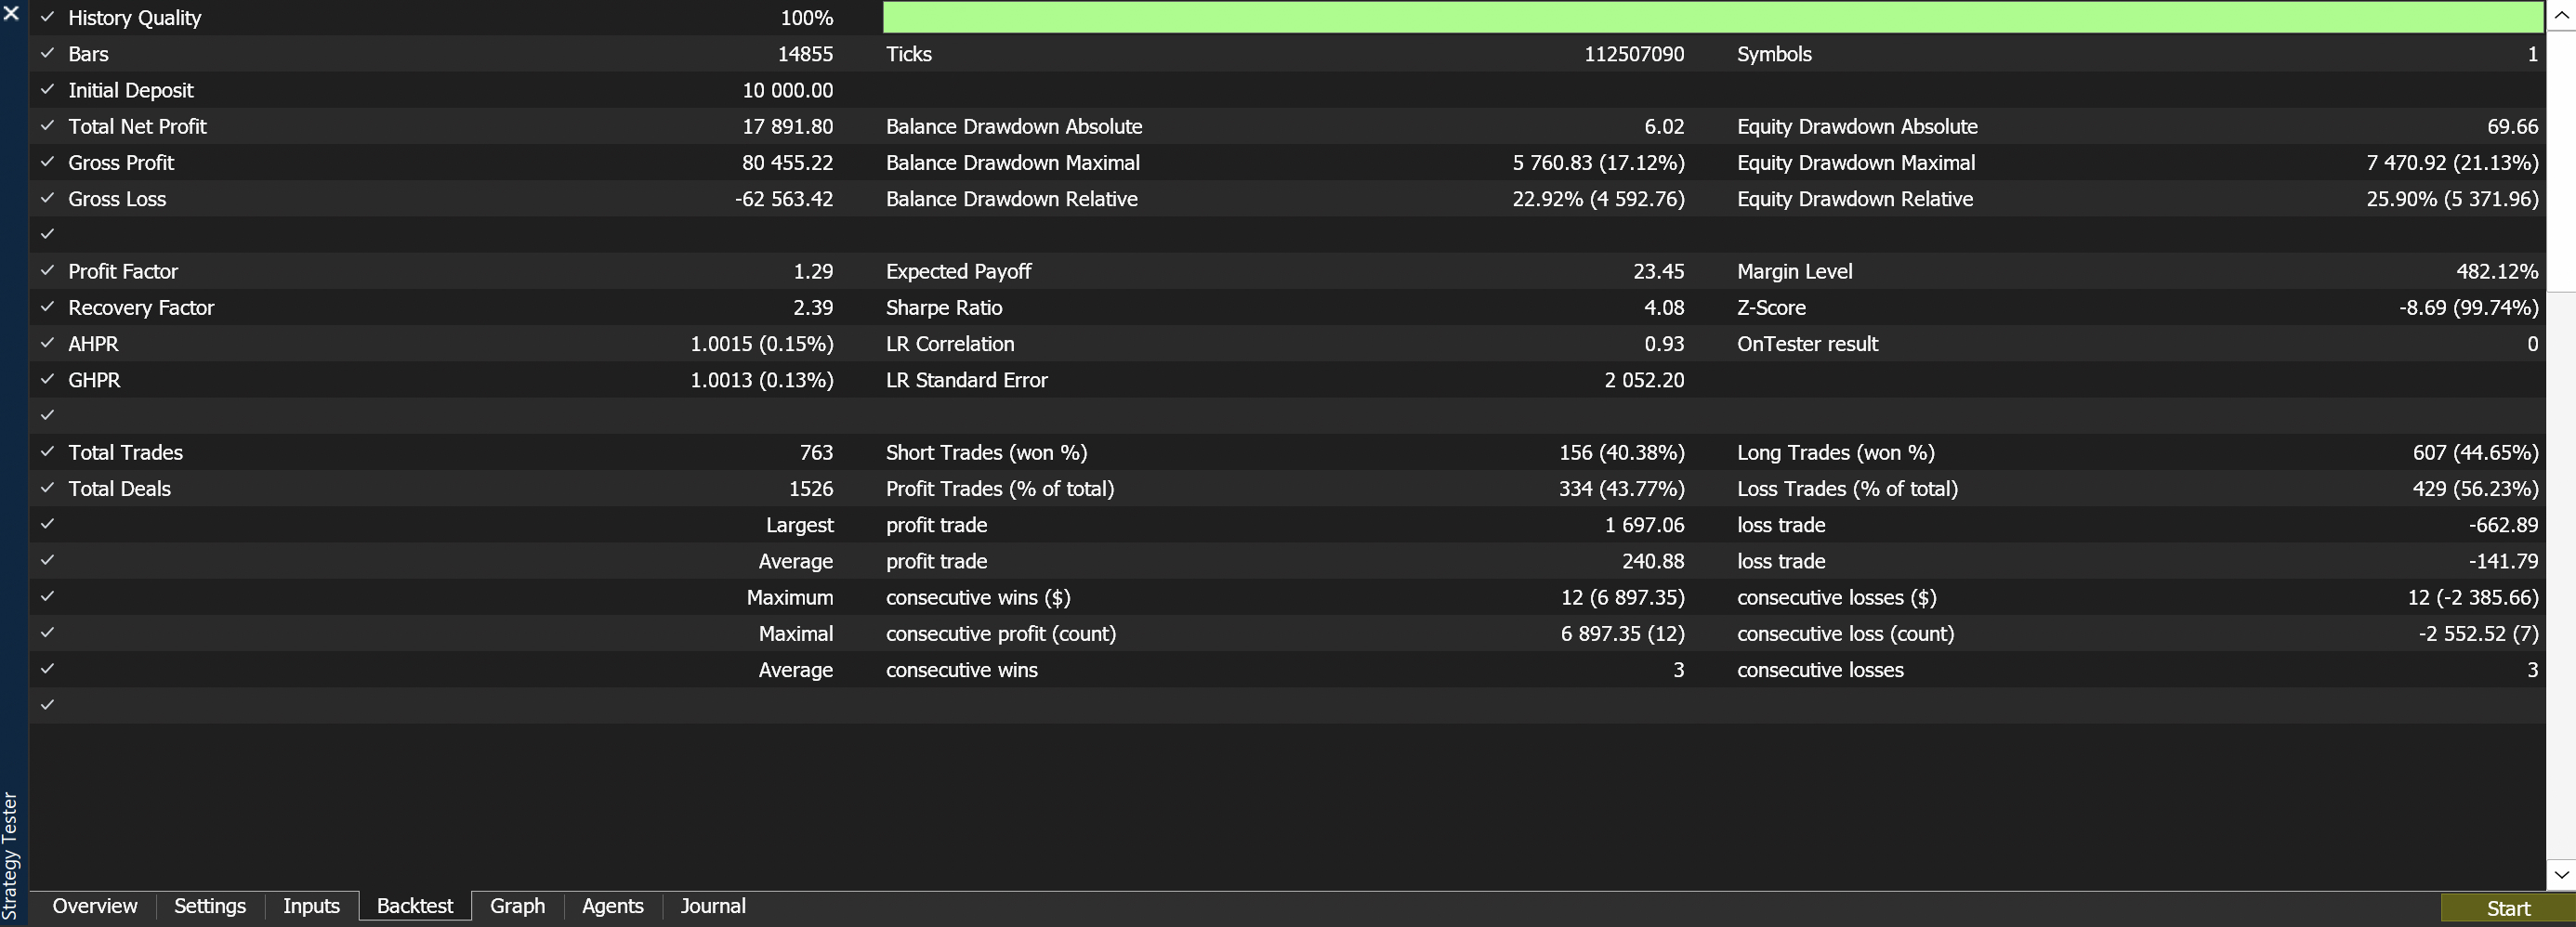
Total Net Profit
Total Net Profit is the final aggregate result after the gains and losses represented in the report. Confirm how commission and swap appear in your build and export. A positive number says nothing by itself about the path, capital at risk, sample size, or dependence on one outlier.
Useful follow-up questions:
- What percentage of net profit came from the largest winning trade or best month?
- Does the result remain positive when that outlier is examined separately?
- Did lot size rise with balance, making late trades dominate early ones?
- Did the EA carry substantial unrealized loss that the balance curve hides?
Gross Profit and Gross Loss
These totals separate winning and losing trades. They expose scale that netting can hide. Two systems can have the same net result while one cycles through much larger gains and losses—and therefore may be more sensitive to costs or execution.
Profit Factor
Profit Factor compares gross profit with the magnitude of gross loss. Above or below a chosen number is not a universal pass/fail rule.
Interpret it with:
- total number of trades
- whether a handful of winners contribute most gross profit
- consistency across untouched periods
- changes under more realistic costs or delay
- the drawdown required to obtain it
If a small parameter or date change causes Profit Factor to collapse, that instability is more informative than the original value.
Expected Payoff
MetaQuotes defines Expected Payoff as the statistically calculated average return of one deal in the report. It is an average, not a promised return on the next trade. Compare it with transaction costs, dispersion between deals, and sample size. A positive average built from a few observations is fragile evidence.
Total Trades, deals, and orders
MT5 distinguishes orders, deals, and positions. One trading idea can generate multiple deals—for example partial fills or partial exits—so verify what the displayed count represents in your report.
Trade count matters because sparse strategies provide less evidence, but a large count does not automatically make biased data or a flawed test reliable. Also check whether trades are clustered in one market regime.
Win rate and average win/loss
Percent profitable is incomplete without payoff size. A high win rate can coexist with occasional losses that erase many winners. A low win rate can coexist with larger winners—but may impose long losing sequences.
Read these together:
win rate
average profit trade
average loss trade
largest profit trade
largest loss trade
maximum consecutive wins and losses
Balance and equity drawdown
Drawdown measures decline, but MT5 reports several forms.
| Field | Practical meaning |
|---|---|
| Absolute drawdown | How far balance fell below the initial deposit |
| Maximal drawdown | The largest peak-to-trough decline expressed in money |
| Relative drawdown | A peak-to-trough decline expressed as a percentage, with the associated amount |
| Equity drawdown | Decline including unrealized profit and loss on open positions |
The exact pair of amount and percentage shown for “maximum” and “relative” can refer to different episodes. Do not assume they describe the same peak and trough.
Equity drawdown deserves special attention. An EA can keep losing positions open, leaving the balance line deceptively calm while equity falls. Compare both curves and inspect the position history around the worst gap.
Recovery Factor
Recovery Factor relates net result to the maximum drawdown used by the report. It is a compact comparison, not proof of recovery speed or future resilience. Two tests with the same factor can have very different stagnation lengths and trade distributions.
Sharpe Ratio
Sharpe Ratio summarizes return relative to variability under the report's calculation assumptions. Its meaning depends on the return series, period, and implementation. Use it as one comparison within otherwise identical tests, not as a universal safety label.
Consecutive losses and stagnation
Maximum consecutive losses translate abstract risk into an operational question: would the system, account, and operator remain intact through a similar sequence?
Also inspect how long the equity curve stayed below a previous high. A strategy can end positive yet spend most of the test in recovery. If stagnation is not directly listed in your terminal, estimate it from the dated equity curve and exported deals.
5. Inspect trades for concentration and rule violations
Sort or export the orders/deals and ask:
- Do entry timestamps match the intended session and signal timeframe?
- Are exits caused by the stated rule, stop, target, or end-of-test closure?
- Did one day, month, side, or symbol regime produce most of the gains?
- Are losses larger when spread or volatility expands?
- Did volume increase unexpectedly after a loss or balance change?
- Do trades overlap when the design permits only one position?
A useful concentration check is to calculate net profit after removing the largest winner—not to create a new headline result, but to see how dependent the conclusion is on one event. Repeat by month or market regime when the sample supports it.
6. Read Graph as a risk timeline
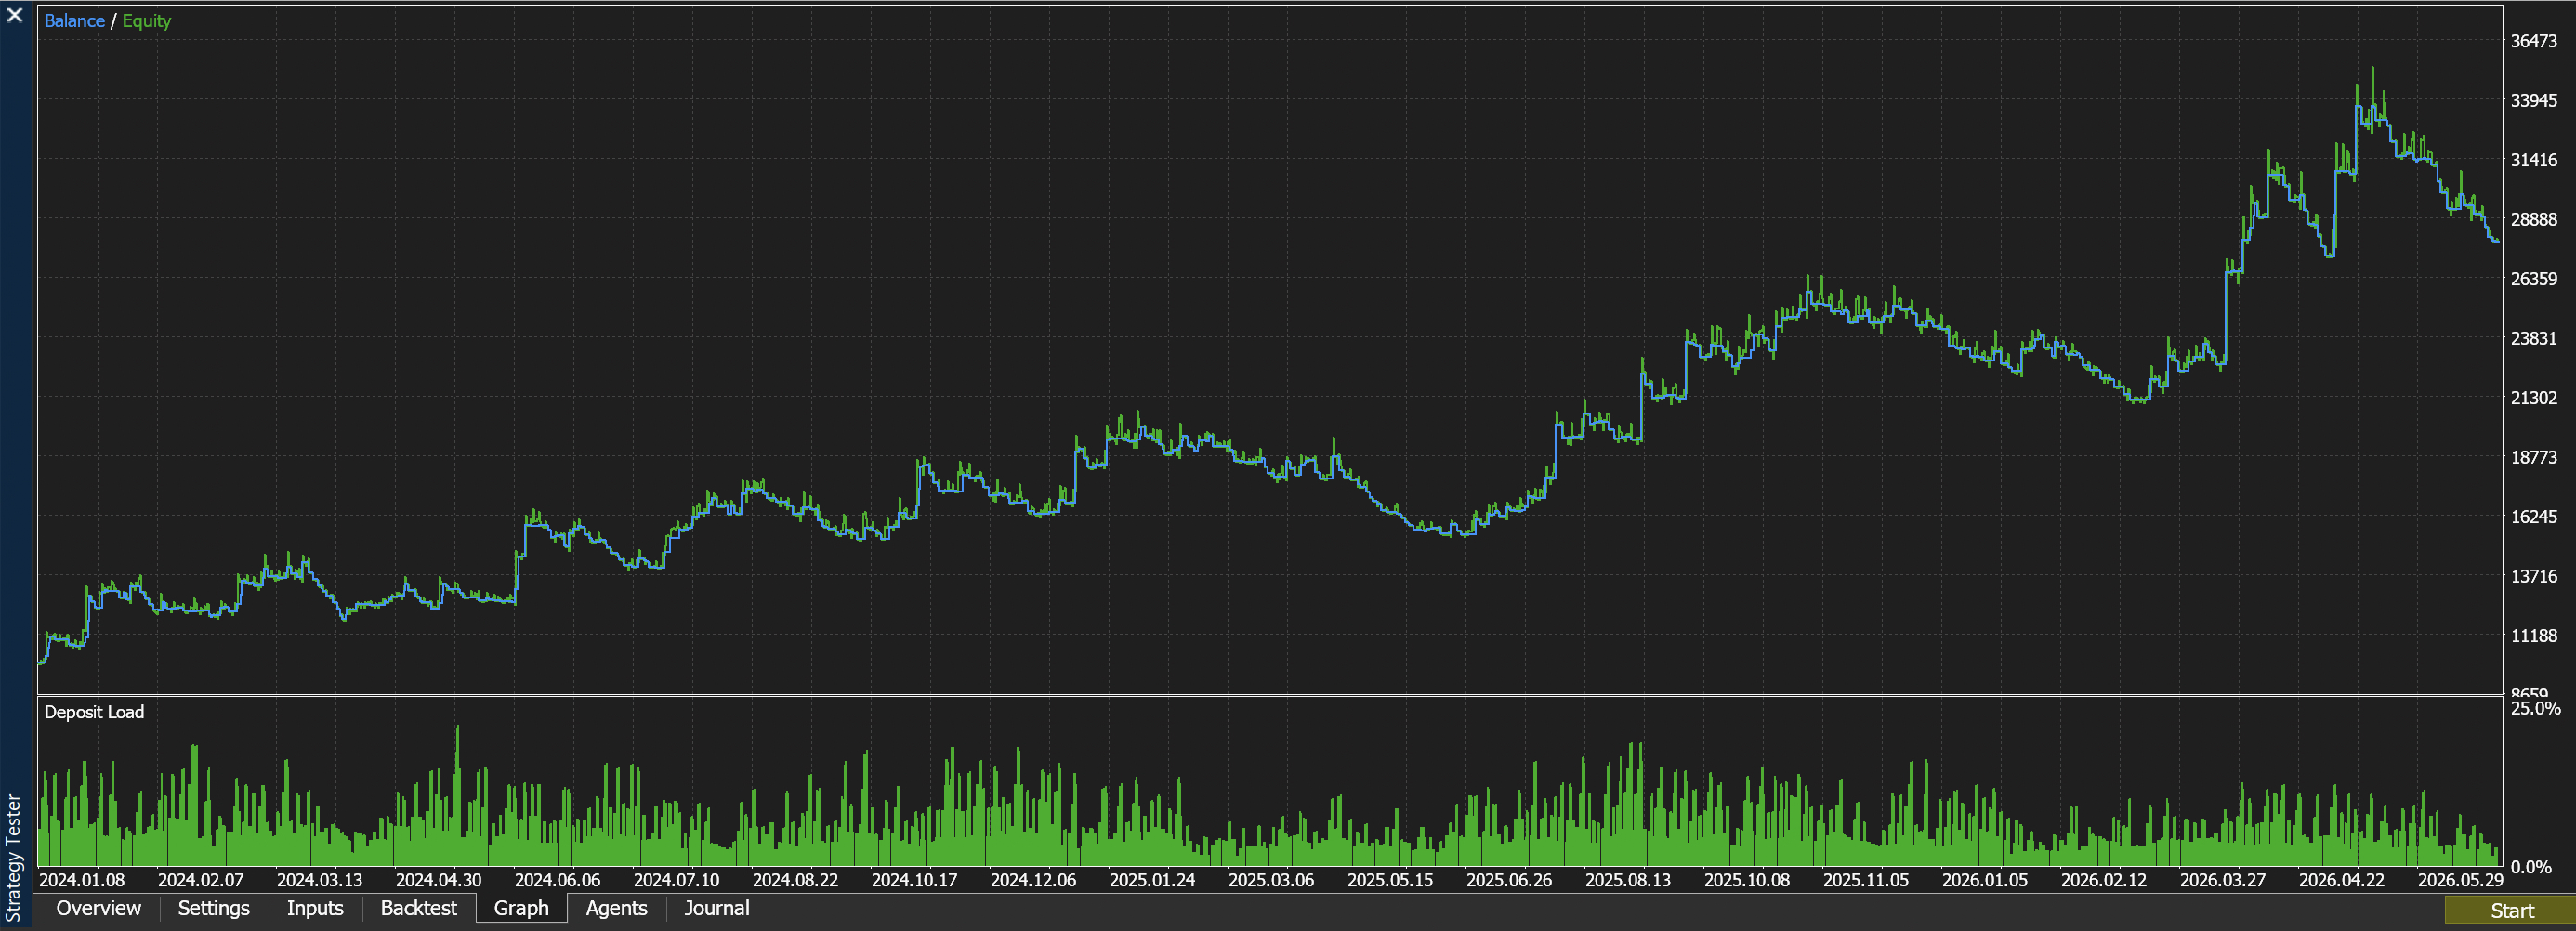
Look for shapes that require explanation:
| Pattern | Investigation |
|---|---|
| Balance rises while equity repeatedly dives | Open losses may be held until recovery or closure |
| Most profit arrives near the end | The result may depend on one regime or on increasing size |
| Long flat sections | The strategy may be inactive, stuck, or highly regime-dependent |
| Sudden step down | Find the exact trades, gap, sizing change, or stop behaviour |
| Persistent high deposit load | Margin use may leave little room for adverse movement |
An attractive upward slope is an observation, not an explanation. Trace every major step or divergence back to dated trades and Journal events.
7. Compare like with like across periods
Freeze the EA and inputs, then build a comparison table from contiguous windows:
| Field | Development | Out-of-sample | Stress period | Forward demo |
|---|---|---|---|---|
| Exact dates | Record | Record | Record | Record |
| Total trades | Record | Record | Record | Record |
| Net result | Record | Record | Record | Record |
| Max balance/equity drawdown | Record both | Record both | Record both | Observe |
| Profit Factor / Expected Payoff | Record | Record | Record | Observe cautiously |
| Largest trade contribution | Calculate | Calculate | Calculate | Observe |
| Consecutive losses | Record | Record | Record | Observe |
| Journal errors | Explain | Explain | Explain | Explain |
Do not invent a guaranteed metric threshold. Instead, define what would falsify the strategy logic before viewing the holdout result—for example, orders occurring outside the intended session, risk limits being bypassed, or performance being entirely attributable to one event.
If you tune after seeing the out-of-sample result, it is no longer untouched. Record the change and reserve a new holdout or use walk-forward research methods.
A decision framework that avoids “pass = go live”
Classify the next action, not the EA as permanently good or bad:
| Status | Meaning | Next action |
|---|---|---|
| Invalid run | Errors, missing conditions, or unreproducible settings | Fix the experiment and rerun |
| Logic defect | Trades do not match the written rule | Fix code and add a regression test |
| Fragile evidence | Result depends on a period, outlier, cost assumption, or small sample | Design a targeted falsification test |
| Research candidate | Logic is reproducible and limitations are understood | Observe unchanged rules on forward demo data |
| Rejected hypothesis | Predetermined risk or behaviour constraint fails | Document and stop tuning that hypothesis |
Even “research candidate” does not mean ready for live funds. Forward demo observation can reveal timezone, session, spread, state-recovery, and operational defects that a historical test misses.
Five-minute report checklist
- Journal has no unexplained recurring errors.
- EA version, symbol, dates, model, account settings, and inputs are saved.
- Historical coverage spans the claimed test period.
- Costs and execution assumptions are stated.
- Total Trades is interpreted in the context of orders/deals and time clustering.
- Net profit is not presented without balance and equity drawdown.
- Largest winners and losing sequences have been inspected.
- Balance/equity divergence and margin load have explanations.
- The unchanged configuration has been tested on untouched dates.
- The conclusion names limitations and the next falsification test.
Frequently asked questions
Where are Results and Report in my MT5 terminal?
Open Backtest after a completed single run. Some builds call the corresponding output Results, and report export may be in the context menu rather than a separate Report tab. Overview is generally the task/start screen.
What Profit Factor is “good”?
There is no guaranteed universal cutoff. A value has meaning only with the number and distribution of trades, drawdown, costs, parameter stability, and untouched-period evidence.
Does a positive backtest justify live trading?
No. It justifies further investigation if the experiment is valid. Historical simulation cannot guarantee future quotes, liquidity, latency, or strategy behaviour.
Is win rate more important than drawdown?
Neither should be isolated. Win rate ignores payoff size; drawdown ignores some aspects of return distribution and operational risk. Read them with average win/loss, tail trades, equity exposure, and consecutive losses.
Risk note
Strategy Tester output is a historical simulation produced from selected data and assumptions. It can understate or misrepresent future spread, slippage, gaps, liquidity, downtime, and behavioural change. Leveraged trading can result in rapid and substantial losses.
This article is educational and does not recommend a broker, EA, instrument, parameter set, or trade. For field definitions, use the official MetaTrader 5 Testing Report reference opens in a new tab alongside your terminal build.
Up next
Next, use How to Forward-Test an MT5 EA on a Demo Account to audit uptime, duplicate orders, protective stops, backtest-to-demo drift, and the conditions that block further escalation.